Pump motor temperature rise limits for safe industrial operation
“Pump motor temperature rise acceptable limits” sounds like the sort of question that should yield one clean number.
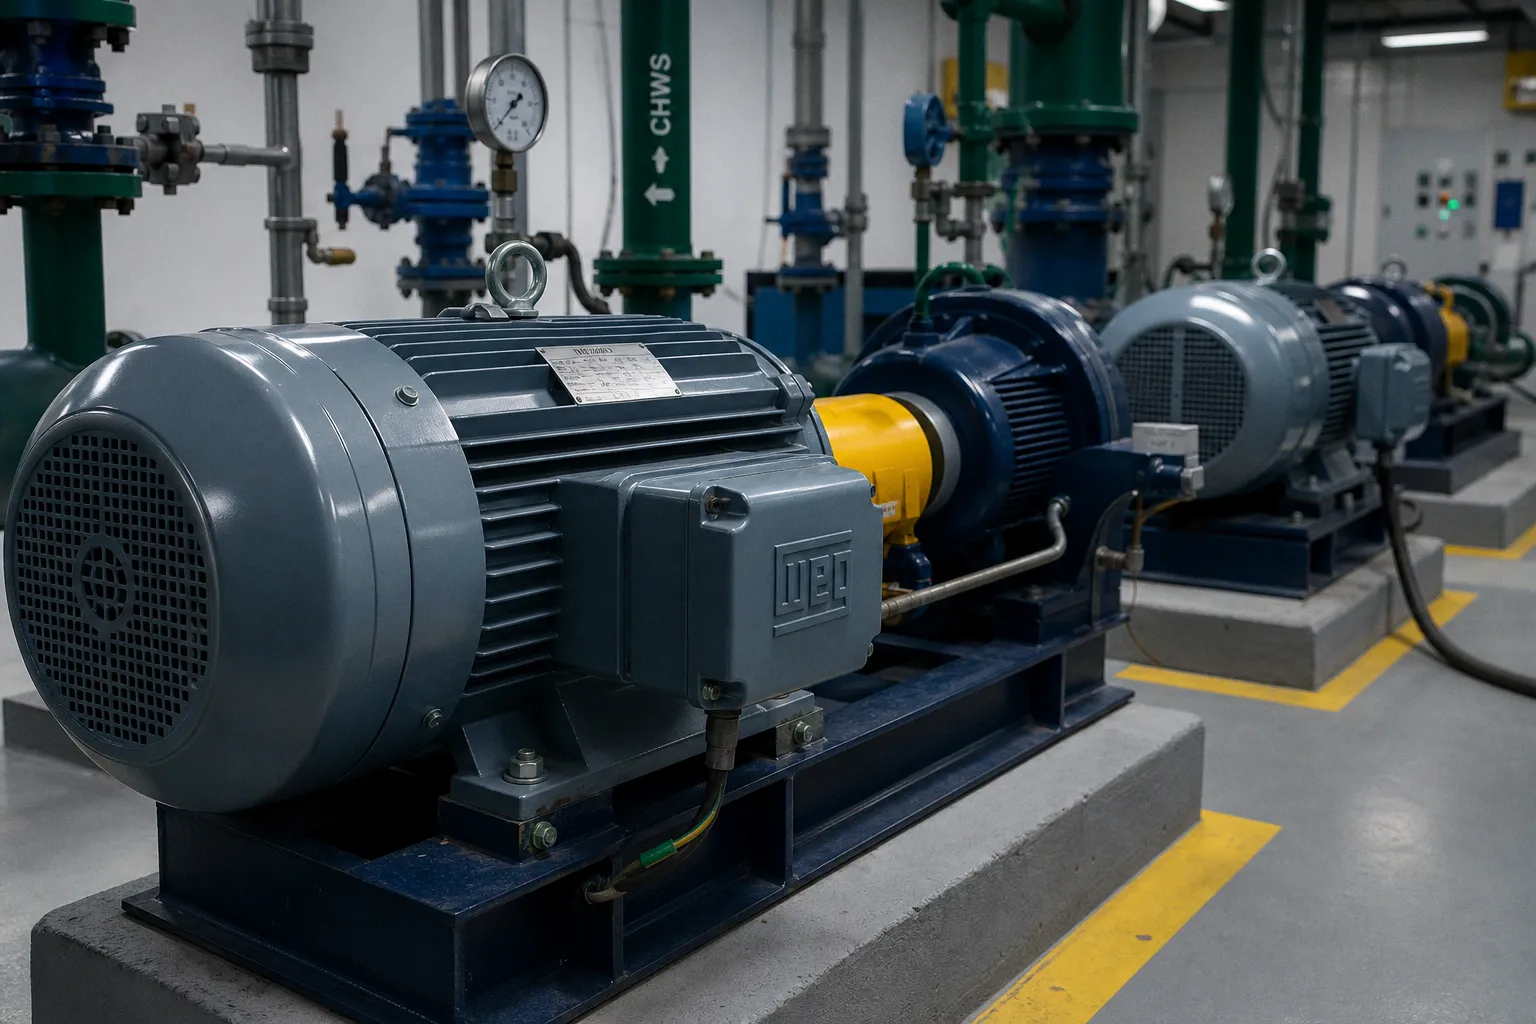
Plant teams want it to be 80°C, or 105 K, or “anything below 90°C on the thermal camera.” Then someone prints that number, sticks it beside the MCC, and calls the thermal problem managed.
That is how bad maintenance taxonomy starts.
A pump motor does not have one universal safe temperature-rise limit. It has a rated insulation system, a duty point, an ambient reference, a cooling arrangement, a measurement method, and—if the installation is not entirely improvisational—a manufacturer-defined protection scheme. Strip those labels away and the number becomes noise.
The distinction matters because industrial pump overheating rarely begins as a motor-only event. A throttled process, a damaged impeller, a misaligned coupling, a bearing beginning to complain, a VFD running outside the cooling envelope, or a clogged fan cover can all raise thermal stress. The motor reports the problem. It does not necessarily own it.
A hot motor is a symptom. “Class F” on the nameplate is not a permission slip to ignore the symptom.
Temperature rise is not motor temperature
I still see reports that state: “Motor temperature: 78°C. Within limit.” Within which limit? Measured where? At what ambient temperature? Under what load? The report usually goes quiet right there, which is convenient because the missing context is the whole job.
Temperature rise means the difference between the winding temperature and the ambient air temperature around the motor. It is not the temperature of the frame, terminal box, end shield, or the brightest patch in a thermal image.
If a winding has a temperature rise of 80 K in a 40°C ambient environment, the implied winding temperature is roughly 120°C before any allowances or measurement-method details enter the picture. But that arithmetic only makes sense when the stated rise, ambient baseline, duty, cooling method, and measurement basis all belong to the same motor rating context.
“K” and “°C” express the same-sized increment when discussing a temperature difference. An 80 K rise equals an 80°C rise. The unit is not the trap. The baseline is.
Many industrial motors use 40°C as the standard maximum ambient condition for continuous-duty ratings. It is common, not magical. A process-motor range may be rated for ambient conditions from -20°C to +40°C and altitudes up to 1,000 m. Go above that altitude or install the motor in a 48°C pump house with poor air circulation, and the nameplate assumptions have already left the building. The motor may need derating according to its manufacturer’s documentation.
That is why “the frame was only 75°C” tells me almost nothing by itself. A frame reading depends on:
- the motor’s frame construction and cooling path;
- the location of the reading—drive end, non-drive end, stator shell, terminal box, or fan cowl;
- surface emissivity and whether the infrared camera was set up for the actual surface rather than wishful thinking;
- motor load and ambient temperature;
- ventilation, dirt accumulation, and airflow around the TEFC enclosure;
- the distance between the internal winding hot spot and the external metal surface.
A thermal camera sees emitted infrared energy at the surface. It does not see through cast iron or aluminum to the winding hot spot. Calling a casing temperature “winding temperature” is not diagnostics. It is category error with a color palette.
IEC and NEMA values: useful references, not a menu of alarm settings
IEC-style and NEMA motor references both use insulation classes and temperature-rise concepts, but the values people repeat across sites do not always match because the applicable standards, measurement methods, and motor design contexts differ.
For IEC-style industrial motors rated around a 40°C ambient, commonly cited winding temperature-rise values measured by the resistance method are:
| Insulation class | Typical winding temperature rise by resistance | Corresponding maximum winding temperature at 40°C ambient |
|---|---|---|
| Class B | 80 K | 130°C |
| Class F | 105 K | 155°C |
| Class H | 125 K | 180°C |
NEMA references, in the cited MG 1 context and likewise based on a 40°C maximum ambient, identify these maximum winding-rise values:
| Insulation class | NEMA winding temperature-rise reference |
|---|---|
| Class A | 70°C |
| Class B | 90°C |
| Class F | 115°C |
| Class H | 130°C |
There is no contradiction to solve with a spreadsheet. These are not interchangeable plant-floor trip points. They sit within different standard and design contexts. Measurement method matters. Resistance measurement gives a calculated average winding temperature after operation; embedded RTDs or thermistors observe a local sensor location; thermography observes an exterior surface. Those are different instruments answering different questions.
The practical message is blunt: use the motor documentation, nameplate data, wiring diagram, and installed protection configuration first. Use generic IEC or NEMA figures as orientation, not as a substitute for those documents.
The insulation class tells you what the insulation system can tolerate under defined conditions. It does not tell you that your particular motor was designed to run continuously at the top of that class.
That distinction gets lost because “Class F” looks like a large thermal number and procurement descriptions love a large thermal number. But a motor can use Class F insulation while being designed for a Class B temperature rise of 80 K. That is often good engineering: the difference creates thermal margin.
The current IEC rating-and-performance standard for rotating electrical machines is IEC 60034-1:2026, published in March 2026. Standards evolve, product designs evolve, and protection logic evolves with them. The answer is not to chase every revision in a standards library. The answer is to stop treating a class label from an old spreadsheet as the operating manual for every motor in the plant.
Why Class F insulation with Class B rise is usually the better story
A motor built with Class F insulation but designed around an 80 K Class B rise is not under-specified. It is deliberately conservative.
Under the familiar 40°C ambient reference, a Class B-rise design targets a substantially lower winding rise than the 105 K often associated with Class F. That creates roughly 25 K of thermal margin between the design rise and the Class F reference rise. Margin is what lets a motor endure ordinary reality: a warmer-than-expected room, minor voltage imbalance, contaminated cooling ribs, a summer process load, or a period of elevated demand before the maintenance team reaches it.
That margin is not spare capacity to burn through every day.
I have watched teams do exactly that. Someone sees “Class F” on the motor plate, observes elevated temperatures, and concludes there is no issue until the calculation reaches 155°C. Meanwhile, grease ages, bearing clearances shift, terminal connections cook, and the motor works harder to survive conditions it should never have been asked to normalize.
A better hierarchy looks like this:
1. Operate to the motor’s stated rating, not the insulation class headline. If the manufacturer specifies Class F insulation with Class B rise, the lower rise is the design target that matters for continuous operation.
2. Treat temperature trend as more valuable than a single reading. A motor that has run at the same load and ambient condition for months but rises 12 K above its own normal profile deserves attention even if it remains below an abstract class limit.
3. Separate thermal capacity from process load. A pump operating too far right on its curve can overload the motor. A pump starved at suction can create hydraulic instability. Neither problem becomes acceptable because the motor insulation has a higher class.
4. Account for the cooling method. A TEFC motor cooling itself with a shaft-mounted fan does not behave identically across its speed range. Reduce speed on a VFD, restrict airflow, then retain the same load expectation, and the thermal arithmetic becomes over-engineered fiction.
5. Use protection sensors as protection sensors. RTDs and PTC thermistors belong in a documented alarm-and-trip strategy. They are not decorative accessories to be ignored until the motor smells expensive.
Thermal margin exists to absorb abnormal conditions, not to turn abnormal conditions into the baseline.
The distinction is especially relevant in pump service because pumps create variable mechanical demand. A motor can run cool at commissioning and hot six months later without any electrical defect. Process density changes. A control valve position changes. The impeller wears. The coupling drifts after pipe strain takes hold. The motor sees the result as current and heat.
The thermal camera is a screening tool, not a winding thermometer
Infrared thermography earns its place in pump maintenance. It is fast, non-contact, and excellent at revealing asymmetry, restricted cooling, abnormal bearing zones, and bad connections. What it does not do is measure internal winding temperature through the motor frame.
That limitation is not a minor technical footnote. It changes how an inspection program should work.
A thermal image taken on a lightly loaded motor can look calm because the machine has not generated enough heat for the defect to separate itself from background noise. For meaningful thermographic inspection, motor load should be at least 40% of design load; higher loading generally makes abnormal thermal differences easier to see. A pristine image from a motor idling at 15% load has limited diagnostic value.
When I audit thermal routes, I look for repeatability before I look for dramatic colors:
- Capture images at comparable load, speed, ambient conditions, and camera angle.
- Record the exact points: drive-end bearing housing, non-drive-end bearing housing, stator frame, terminal box, and cooling-air inlet and outlet where accessible.
- Compare identical duty motors where the layout permits it, but do not pretend two pumps with different hydraulic loads are twins.
- Pair thermal images with motor current, vibration data, process conditions, and recent lubrication history.
- Track deltas from the machine’s own baseline rather than inventing one global frame-temperature limit for every motor in the facility.
A hot terminal box relative to the stator frame may point toward a connection issue, phase imbalance, or cable problem. A localized hot drive-end bearing housing may point toward lubrication, bearing damage, excessive belt load, coupling misalignment, or pump-induced radial load. A uniformly hot frame can suggest overload, poor cooling, high ambient conditions, or a motor simply operating near its continuous rating.
Each pattern narrows the investigation. None closes it.
The fastest route to a bad diagnosis is to point the camera at a dusty motor, get 86°C on a reflective patch, and announce a winding-temperature event. Set emissivity correctly. Avoid reflections. Use repeatable viewing angles. Then corroborate what the camera suggests with the data the motor and pump are already producing.
Pump-side faults that become motor thermal problems
The phrase “industrial pump overheating causes” often produces a generic list: overload, poor ventilation, voltage imbalance. Fine, but the more useful question is why the motor load changed.
A motor temperature problem often sits downstream of a pump or installation problem. The pump is the load machine. If it behaves badly, the motor pays in current and heat.
Pump running too far right on the curve
If system resistance falls, a centrifugal pump can move toward higher flow and higher absorbed power. Depending on the pump curve and impeller geometry, the motor can become overloaded. Typical causes include a bypass left open, a valve position changed during process modification, an incorrect impeller trim, or a system redesign that managed to ignore the original duty point. That last one is more common than anyone admits.
Check actual flow, suction and discharge pressure, motor current on all phases, VFD speed, and the pump curve. Do not begin with the motor fan cover just because it is easy to reach.
Misalignment and pipe strain
A flexible coupling is not an apology for poor alignment. Angular or parallel misalignment creates losses and bearing load. Pipe strain can shift the pump casing after alignment, making a clean laser result at installation functionally irrelevant once the system is bolted together and hot.
Thermal symptoms may appear at the drive-end bearing housing or as a general load increase. Vibration analysis, precision shaft alignment, and a check for soft foot give a much better picture than temperature alone.
Bearing distress and lubrication mistakes
Bearing heat is not a generic “high temperature” event. It has a mechanical story behind it: too much grease, too little grease, wrong grease, contamination, bearing damage, excessive preload, misalignment, or external loading.
The lazy approach is to pump in more grease when the housing gets hot. Over-greasing can create the very churning and heat it was meant to cure. A lubrication interval without a grease quantity, purge path, bearing type, and operating-speed context is maintenance bloat disguised as procedure.
Cooling failure
TEFC motors are robust until their cooling path gets treated as optional. Fins collect product dust. Fan covers clog. Air recirculates in tight enclosures. VFD-driven motors slow down while load remains demanding. In washdown or corrosive service, external buildup can be even more persistent.
Inspect the cooling path physically. “Fan appears intact” is not an inspection result. Confirm airflow, cover condition, fin cleanliness, and clearance around the motor. Then check whether the operating speed and torque remain inside the motor’s permitted thermal envelope.
Electrical supply and control issues
Voltage imbalance, loose terminations, harmonic effects in VFD applications, incorrect overload settings, and phase-current imbalance can all contribute to thermal stress. Again, a hot frame does not tell you which one.
Measure all three phase currents under stable process conditions. Compare voltage balance at the motor terminals, not only at the MCC. Review VFD output parameters and the motor’s inverter-duty suitability where relevant. The cable, drive, and motor are one system; splitting them into separate troubleshooting silos creates friction and delays the fix.
Bearing alarms and trips: stop copying numbers across machines
Bearing protection settings are another place where copied values do damage. It is tempting to choose a clean pair of numbers—say, 110°C alarm and 120°C trip—and apply them to every pump motor. Those values do appear in a WEG W22Xd flameproof motor manual for a specific motor context. They are not universal bearing thresholds.
The manual itself makes the point: application-specific settings may need to be lower and must not exceed the stated table values. Bearing construction, lubrication, sensor location, cooling arrangement, hazardous-area certification, and operating duty all influence the proper setting.
A flameproof motor on a critical hydrocarbon service does not share the same risk profile as a standard TEFC motor on a utility-water pump. A grease-lubricated bearing does not behave like an oil-lubricated assembly. A sensor mounted close to an outer race does not report the same thermal condition as one embedded elsewhere. Copy-paste settings flatten all of that into one number and call it standardization.
The right workflow is less glamorous and far more useful:
1. Start with the exact motor manual and the installed sensor type. Confirm whether the device is an RTD, PTC thermistor, thermostat, or another element with different control behavior.
2. Verify the wiring diagram and relay or VFD configuration. A sensor wired into an alarm-only circuit is not a trip system, regardless of what the maintenance database says.
3. Establish normal operating temperatures at real process loads. Record ambient temperature, motor current, speed, pump duty, and bearing condition alongside sensor readings.
4. Set alarm thresholds early enough to investigate before protection trips the machine. The distance between normal operation, alarm, and trip should reflect the rate at which the specific failure can develop—not a corporate template.
5. Review trip events with root-cause discipline. Resetting a thermal trip without identifying overload, cooling failure, bearing distress, or electrical imbalance turns protection into a recurring nuisance alarm. Then someone eventually bypasses it. That is the predictable final stage of bad design.
What a defensible monitoring strategy actually looks like
Motor winding temperature monitoring works when it combines direct sensors, electrical loading data, external thermal inspection, and machine-condition evidence. It fails when one tool is asked to impersonate all the others.
For a critical pump train, I would want a practical data stack rather than an over-engineered dashboard:
| Signal or method | What it can reveal | What it cannot prove alone |
|---|---|---|
| Embedded winding RTD or thermistor | Internal thermal condition at the sensor location; alarm/trip input | Exact winding hot-spot temperature everywhere in the stator |
| Bearing temperature sensor | Developing bearing heat and thermal trend | Root cause of the heat |
| Infrared thermography | External hot spots, cooling restrictions, terminal anomalies, comparison between similar assets | Internal winding temperature |
| Phase current and voltage readings | Overload, imbalance, abnormal electrical demand | Whether the source is hydraulic, mechanical, or electrical without more context |
| Vibration data | Bearing condition, misalignment, looseness, hydraulic disturbance | Safe winding temperature |
| Pump process data | Duty-point shift, flow and pressure deviations, process-driven overload | Internal motor condition by itself |
The point is not to collect more data because dashboards make management comfortable. The point is to remove ambiguity fast enough to act before insulation, grease, or bearings take a permanent hit.
I prefer a baseline established after commissioning or after a verified repair, then revisited under comparable operating conditions. That baseline should include winding-sensor readings where available, bearing temperatures, motor current, vibration levels, speed, ambient conditions, and the pump’s actual process duty. A single absolute number has value. A trend with operating context has much more.
The verdict: use the motor’s design data, not folklore
There is no single answer to pump motor temperature rise acceptable limits because the question bundles together winding rise, surface temperature, insulation class, bearing temperature, ambient conditions, and protection logic as if they were one thing. They are not.
Use Class B, F, and H values to understand the thermal landscape. Do not turn them into universal operating limits. A Class F motor may be intentionally designed for an 80 K Class B rise. A 110°C bearing alarm may be correct for one specified motor and reckless for another. A thermal-camera reading on the frame may expose a problem, but it does not certify the winding temperature.
Do this: read the exact motor documentation, verify sensor configuration, establish a baseline at real load, and investigate deviations through pump duty, alignment, bearings, cooling, and electrical supply.
Not that: point a camera at the casing, compare the result to a number copied from another motor, and call the asset safe.