Pump vibration analysis: essential data for accurate diagnostics
Most pump vibration programs do not fail because the plant lacks an analyzer. They fail because someone collects a number, calls it “the vibration reading,” and then acts surprised when the number explains nothing.
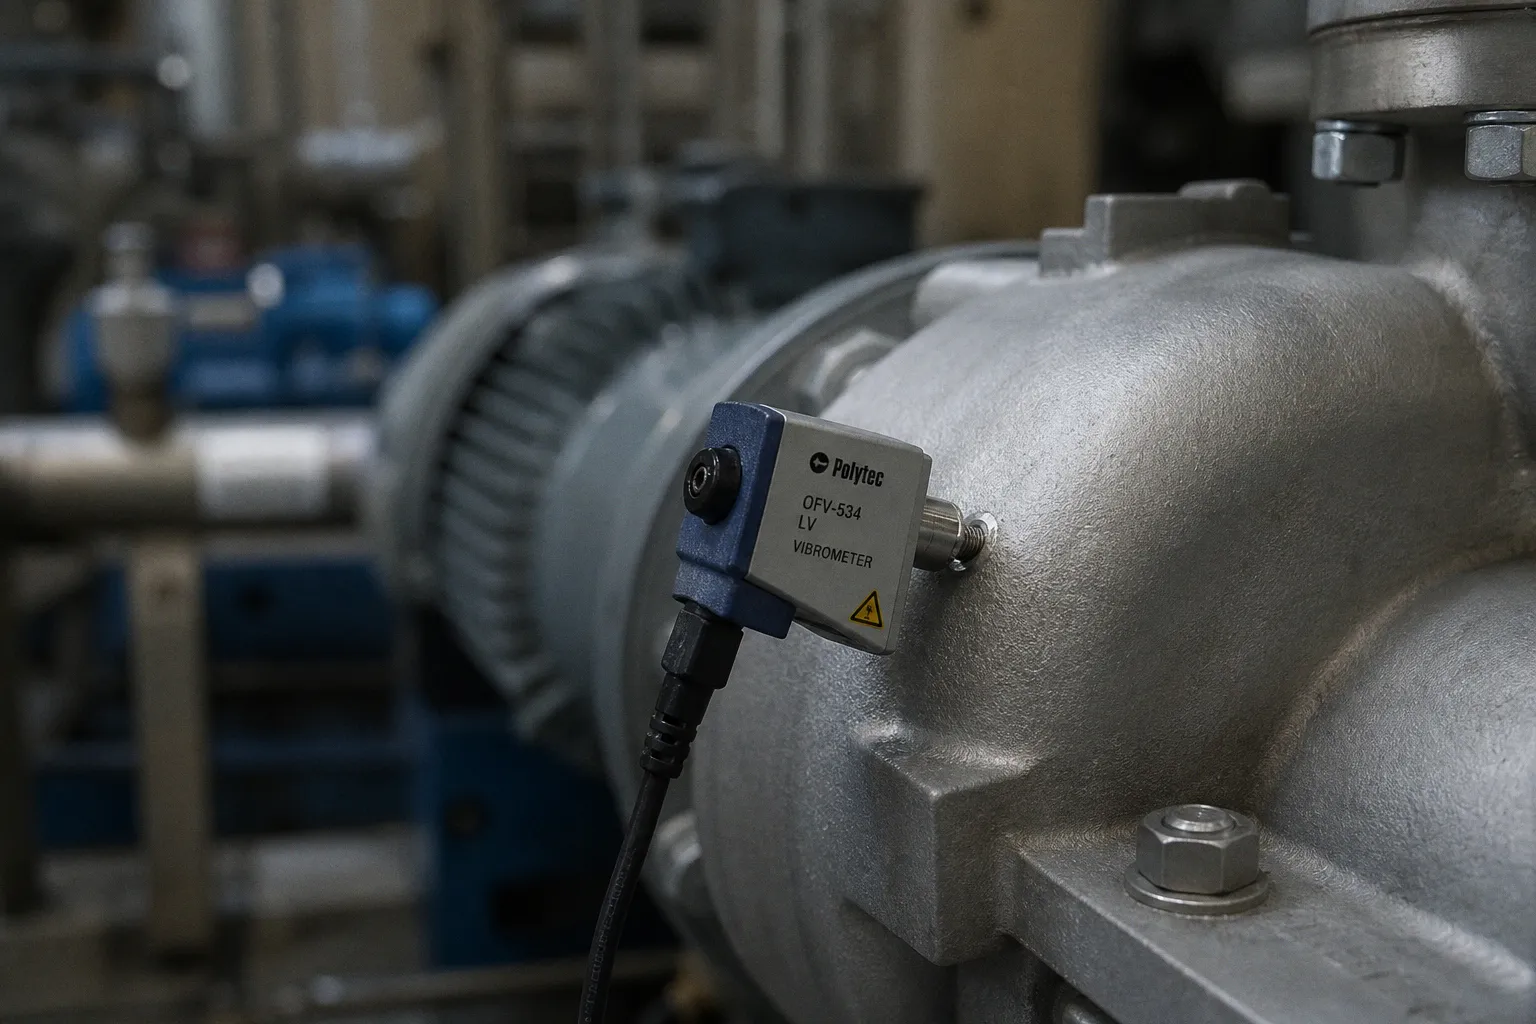
I have seen plants trend a single overall value for years, mounted from a different spot every round, at a different load, with a different magnetic base, and then call the resulting graph predictive maintenance. It is not predictive. It is noise with a timestamp.
Industrial pump vibration analysis data requirements are not glamorous, but they are brutally simple: measure the right quantity, at the same locations, under known operating conditions, across a frequency range that fits the machine and the suspected fault. Miss one of those pieces and the diagnostic chain develops friction fast.
A vibration value without location, direction, speed, load, and frequency context is not condition data. It is a loose number.
This is the practical checklist I use when auditing a pump vibration monitoring setup. Not the over-engineered version that fills a dashboard. The version that gives maintenance teams a fighting chance of identifying a fault before it turns into a seal failure, bearing event, or a pump that suddenly “needs” replacement.
Start with the measurement quantity, not the instrument menu
The first bad pattern is treating displacement, velocity, and acceleration as interchangeable units. They are not. A modern analyzer can display all three, which has apparently convinced many teams that selecting one is a matter of personal taste.
It is not.
Each quantity emphasizes a different part of the vibration picture. If the pump runs slowly and the issue sits at low frequency, acceleration alone can bury the useful signal. If the team relies only on overall velocity, early bearing damage may remain invisible beneath an acceptable severity number. If cavitation or hydraulic turbulence is the concern, a low-frequency displacement trend will not tell the full story.
| Measurement quantity | What it exposes well | Where teams misuse it |
|---|---|---|
| Displacement | Low-frequency motion, unbalance effects, journal-bearing behavior, shaft-related movement | Used as a universal health metric on faster rolling-element-bearing machines |
| Velocity | Broad machine-condition severity and general trending across a useful mid-frequency range | Treated as proof that bearings are healthy because the overall number looks calm |
| Acceleration | Higher-frequency bearing activity, cavitation, turbulence, impacting | Collected without a suitable frequency range, sampling rate, or mounting method |
For rotodynamic-pump acceptance testing, Hydraulic Institute guidance uses overall RMS vibration velocity on stationary bearing-associated parts for pumps above 600 rpm, with a stated minimum measurement band of 5 Hz to 1,000 Hz. At 600 rpm and below, the guidance calls for peak-to-peak bearing-housing displacement in addition to velocity, with instrumentation spanning at least 2 Hz to 1,000 Hz.
That does not mean every condition-monitoring route should blindly copy those bands. Acceptance testing and detailed fault diagnosis serve different jobs. The useful lesson is more basic: pump speed changes what a meaningful measurement looks like. Slow pumps need low-frequency visibility. Faster machines and rolling-element bearings demand enough high-frequency content to catch developing damage.
My practical rule is blunt:
1. Use overall velocity for a consistent broad condition trend. It works well as a first-level indicator, especially when the route, mount, load, and frequency settings stay fixed.
2. Add displacement when low-speed pump behavior or shaft-motion issues matter. Below 600 rpm, low-frequency information stops being a nice extra and becomes part of the diagnostic picture.
3. Use acceleration and high-frequency spectral review for early bearing and hydraulic faults. This is where cavitation, turbulence, and impact behavior often announce themselves before the overall velocity trend gets dramatic.
4. Document the selected band and processing settings. A velocity value gathered over one band is not automatically comparable to a value gathered over another. That sounds obvious. It routinely gets ignored.
The point is not to collect more channels because the software has more buttons. That is bloat. Collect the signals that answer a specific maintenance question.
Fix sensor placement before you start trending
I can usually tell within five minutes whether a vibration program will produce usable history. I look at the route points.
If the point is named “Pump DE,” with no direction, no physical description, and no photograph or diagram, the program is already compromised. “Drive end” is not a measurement location. It is a vague memory of one.
For horizontal pumps, place the transducer as close as practical to the centerline of the radial-bearing location on the bearing housing. For vertical pumps, the motor mounting flange may provide the appropriate measurement point. What you should not do is mount on flexible guards, nameplates, motor end covers, sheet-metal panels, or any other convenient piece of structure that vibrates independently of the bearing system.
That last point matters because sensor placement for pumps is not merely about repeatability. It is about signal integrity. A flexible panel can amplify or attenuate frequencies. A loose magnet can distort high-frequency response. A painted surface can make the next reading subtly different. Then the analyst spends an afternoon interpreting a trend created by mounting variation.
The route point needs four coordinates, not one label
At minimum, each vibration location should record:
- Machine position: pump inboard bearing, pump outboard bearing, motor drive end, motor non-drive end, or a clearly equivalent site-specific description.
- Direction: horizontal, vertical, or axial. These directions carry different diagnostic meaning, but only when they are consistently captured.
- Mounting method: stud mount, adhesive pad, magnetic base, permanently installed sensor, or another defined method.
- Signal configuration: measurement quantity, frequency band, averaging approach, and any filtering used by the instrument.
For a standard horizontal motor-pump assembly, I usually want radial readings in horizontal and vertical directions at accessible bearing locations, plus axial readings where alignment, thrust, or coupling behavior deserves scrutiny. Not every pump needs every channel in every route. But choosing fewer points must be a deliberate risk decision, not a budget-shaped accident.
Change the sensor position and you have changed the test. Pretending otherwise only makes the trend look more scientific than it is.
Permanent sensors can reduce route-to-route variation, especially on critical assets. They can also create a very expensive data stream nobody reviews. Portable collection remains perfectly viable for many services if the route is disciplined: same point, same orientation, same mounting method, same operating window.
Build a baseline while the pump is healthy, not after the alarm
A baseline is not the first reading that happened to make it into the software. It is a controlled reference captured when the pump’s mechanical condition and operating state are understood.
Commissioning offers the cleanest opportunity. A post-repair return-to-service check can also establish a baseline, but only if the work scope, alignment state, bearing condition, hydraulic operating point, and installation condition are known. “Pump is running” does not qualify as known.
Baseline vibration data collection should preserve more than a spectrum file. Without operating context, the record becomes an orphan. A pump at 80% flow and a pump operating near a recirculation zone can produce very different signatures even when the bearings and alignment have not changed.
I want the baseline record to include:
- Pump and motor identification, including asset hierarchy that actually distinguishes the train from its standby twin.
- Measurement point, orientation, mounting method, and sensor type.
- Date and time, plus the technician or system that collected the data.
- Running speed, preferably measured or verified rather than inherited from a nameplate.
- Load or process state: flow, discharge pressure, suction condition, valve position where relevant, and whether the unit operated near its normal duty point.
- Lubrication condition, recent repair work, alignment status, and any known mechanical exception.
- Overall values, FFT spectrum, and time waveform from the same acquisition.
- Frequency range, sample settings, and analysis parameters needed to reproduce the view later.
This sounds like paperwork. It is not. It is the minimum data model for comparing one measurement to another without lying to yourself.
A baseline should also be plural in practice. One clean reading is useful. Several readings across stable operating conditions are much better. Pumps live in process systems, not laboratory vacuum chambers. If normal flow and pressure vary, capture that variation deliberately. You are defining the acceptable operating envelope, not hunting for a single perfect number.
Do not let an overall value diagnose a bearing
Overall vibration is valuable. It is fast, compact, and useful for acceptance and trend alarms. It is also one of the most abused metrics in industrial maintenance.
A smooth overall velocity trend can coexist with early rolling-bearing damage. Bearing defects often generate higher-frequency components with low amplitude relative to the total signal. The overall number may barely move while the relevant defect-frequency pattern starts to emerge in the spectrum.
That is why I treat the overall reading as a gate, not a verdict.
When the trend shifts, or when the asset carries enough production consequence to justify deeper review, retain both the time waveform and the FFT spectrum. They do different jobs:
- The FFT spectrum separates vibration by frequency. It lets the analyst inspect running-speed harmonics, bearing-related frequencies, vane-pass activity, broadband hydraulic noise, and other components that a single overall value blends together.
- The time waveform shows when events occur. It can reveal impacting, modulation, periodic bursts, non-sinusoidal behavior, and repeating patterns that a spectrum alone can flatten into abstraction.
A common shortcut is to spot a 1× running-speed peak and declare unbalance. Another is to see axial 1× and declare misalignment. Both calls may turn out to be right. Neither is proven by one peak.
Structural resonance, soft foot, looseness, hydraulic excitation, speed variation, coupling condition, and measurement direction can all complicate that tidy story. I want corroboration: phase where available, directional comparison, physical inspection, alignment data, operating-condition history, and repeatable signatures across readings.
The same principle applies to cavitation. Elevated high-frequency acceleration and broadband activity can support the suspicion, especially alongside process evidence. But a vibration trace does not grant permission to ignore suction pressure, liquid temperature, inlet restrictions, air entrainment, or operation away from the pump’s preferred region.
Speed and bearing geometry are diagnostic inputs, not optional metadata
A spectrum without running speed is an unlabeled map. You may still recognize a few landmarks, but you should not plan a route around it.
Running speed anchors the entire analysis. It allows conversion between frequency and orders. It helps distinguish components tied to shaft rotation from fixed-frequency electrical or structural phenomena. It also supports calculation of expected fault frequencies for bearings, gears, and related elements.
For rolling-element bearings, the diagnostic parameters need more than shaft speed. The calculation depends on bearing geometry, including:
- Number of rolling elements.
- Rolling-element diameter.
- Pitch diameter.
- Contact angle.
- The bearing’s installed position and load path.
This is where many asset databases collapse into uselessness. They store “bearing: 6312” in a free-text field, perhaps. Then someone changes the bearing during a repair, substitutes an equivalent design, and never updates the database. Months later, a specialist compares a spectral line against an obsolete defect frequency and wonders why the machine refuses to cooperate.
The machine is not being difficult. The data governance is.
For critical pumps, I want the bearing manufacturer and exact designation verified against the actual installed component, not copied from an old bill of materials. For less critical assets, a simpler record may be enough, but the team should know what it has chosen not to know.
Sampling rate can manufacture faults that do not exist
The analyzer’s sampling rate must support the highest frequency of diagnostic interest. This is basic Nyquist logic: if the sample rate is insufficient, the recorded signal can alias. A high-frequency component folds into a false lower-frequency shape, and the resulting spectrum confidently points to a problem that may not exist.
There is no universal sample rate, FFT line count, record length, or averaging count that suits every pump diagnostic task. Anyone selling one setting as the answer for every machine is selling convenience, not diagnostics.
Set acquisition parameters from the question:
- Looking for general running-speed condition? A broad, repeatable velocity setup may be sufficient.
- Investigating slow-speed motion? Ensure the low-frequency range reaches far enough down.
- Hunting early bearing damage or cavitation signatures? Use a setup capable of preserving the higher-frequency content and mount the sensor accordingly.
- Comparing with an earlier baseline? Match the historical setup before declaring that a spectral difference reflects machine condition.
This is not academic fussiness. It separates an actionable alarm from an aliasing artifact that sends a crew to inspect the wrong component.
Standards set boundaries; they do not replace thinking
Preventive maintenance vibration standards help establish common language, test conditions, and evaluation frameworks. They do not eliminate engineering judgment.
ISO 10816-7:2009 addresses vibration evaluation for industrial rotodynamic pumps above 1 kW, including bearing-housing vibration. It remains published, though ISO has marked it for revision. Meanwhile, ISO 20816-3:2022 covers certain industrial machinery above 15 kW and from 120 rpm to 30,000 rpm, but it explicitly excludes rotodynamic pumps within the pump-specific scope.
That distinction matters because standards get misapplied with impressive confidence. Someone finds a severity chart, pastes an alarm limit into the condition-monitoring system, and congratulates the project team on “standardization.” What they have actually standardized may be the wrong machinery class, wrong measurement condition, or wrong response logic.
I do not use a universal alarm number for all pumps because one does not exist in any defensible sense. Limits depend on pump design, speed, installation, power, bearing arrangement, test setting, process duty, and manufacturer requirements. A vertical turbine pump, an end-suction process pump, and a high-energy multistage unit do not share a meaningful single threshold merely because they all move liquid.
Use standards to frame the program. Use commissioning data, machine criticality, operating history, and fault evidence to run it.
The checklist that keeps data from turning into noise
Before calling a pump vibration reading diagnostic-grade, I run through this sequence:
1. Confirm the machine state. Record speed and process condition. A reading taken during recirculation cannot serve as a clean comparison for a reading at normal duty.
2. Use the fixed route point. Same bearing-associated location, same direction, same mount. If the point changed, label it as a changed test condition.
3. Choose the quantity for the suspected frequency range. Do not demand low-speed shaft-motion answers from a high-frequency-only setup.
4. Capture overall, spectrum, and waveform where diagnosis matters. The overall trend shows that something changed; the detailed signals help explain what changed.
5. Retain acquisition settings. Frequency span, sample behavior, filtering, and mounting details belong with the record.
6. Verify component metadata. Speed and installed bearing geometry turn peaks into hypotheses that can be tested.
7. Compare like with like. Different loads, locations, directions, sensor mounts, and bands do not form a trustworthy trend just because the software draws one.
The uncomfortable truth is that industrial pump vibration analysis rarely fails at the interpretation screen. It fails upstream, when somebody decides that context is optional.
Do this: build a small, repeatable dataset around each critical pump, anchored to real bearing locations and real operating conditions. Use overall values for trending, then bring spectra and waveforms into the conversation before naming a fault.
Do not do this: mount wherever the magnet sticks, collect one velocity number, compare it to a generic limit, and call the result predictive maintenance. That is not a monitoring strategy. It is administrative vibration.