Pump vibration analysis: essential data collection checklist
Most industrial pump vibration analysis fails before the sensor touches the machine.
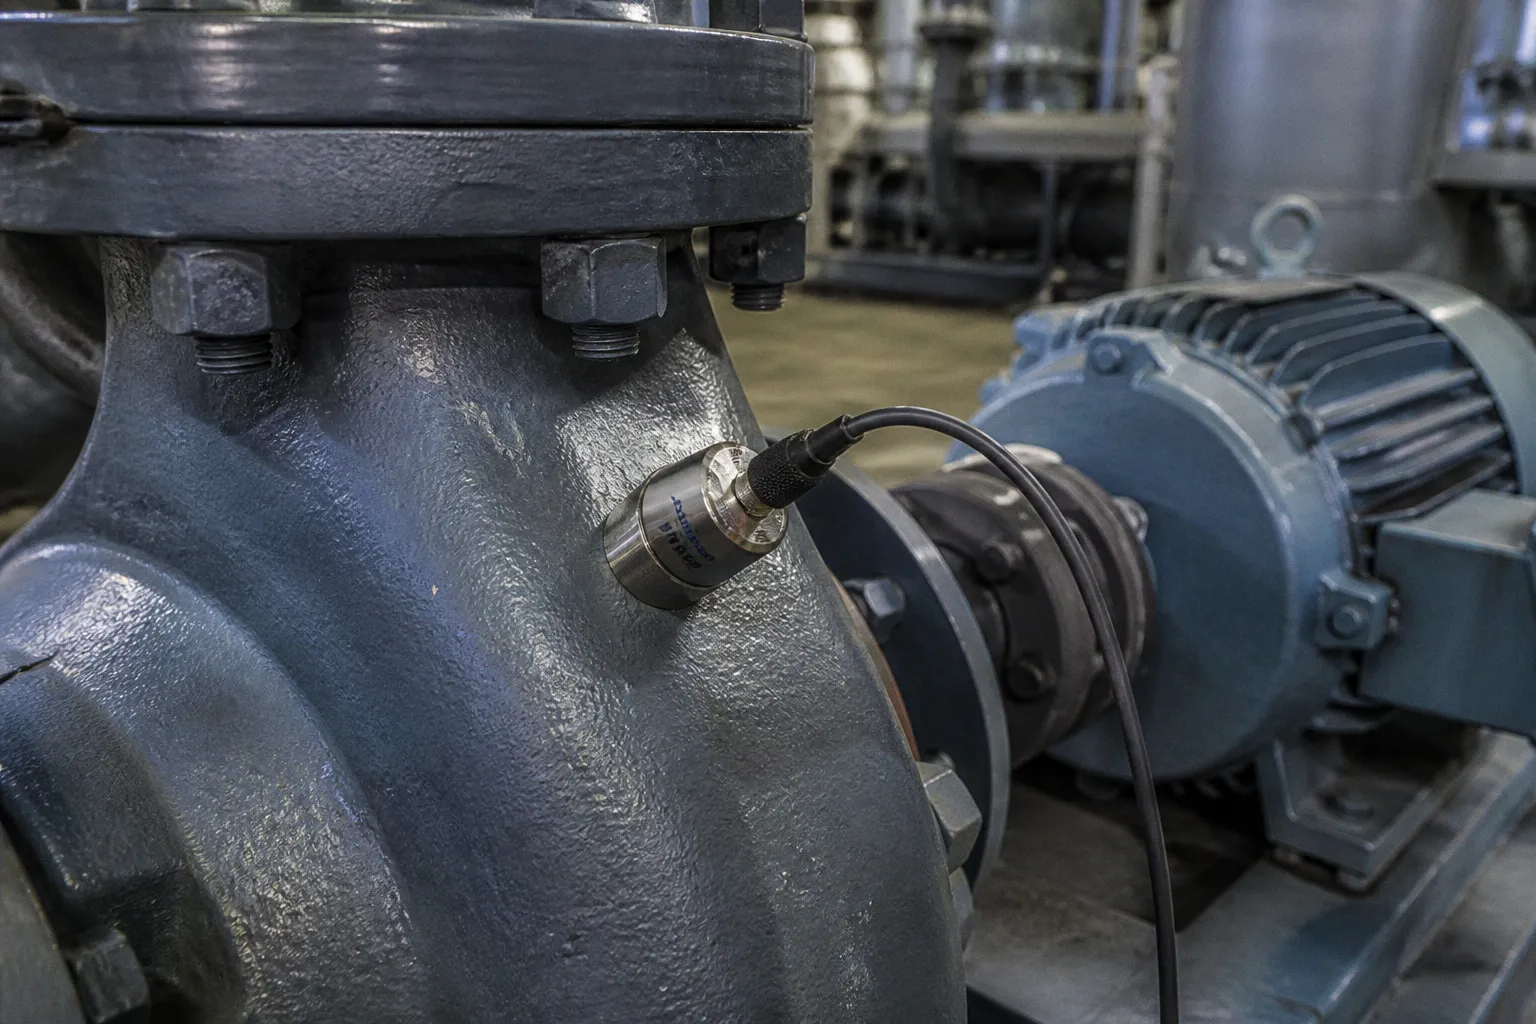
The usual culprit is not poor instrumentation. It is poor context. Someone captures a single overall RMS value, writes down the pump tag, and expects the number to explain whether the machine suffers from imbalance, misalignment, bearing damage, looseness, cavitation, or a hydraulic problem. That is not diagnosis. That is data collection with the useful parts removed.
A credible industrial pump vibration analysis checklist must produce repeatable measurements and preserve the operating conditions behind them. Otherwise, every trend comparison becomes an argument about whether the pump was running at the same speed, load, flow, pressure, temperature, and sensor location. I have seen teams spend days debating a rising trend that came from nothing more sophisticated than a different measurement point.
The rule is blunt: capture the machine state, not just the vibration number.
Standardize the measurement route before you inspect the pump
A vibration reading only becomes useful when you can compare it with previous and future readings. That requires a fixed route, fixed locations, documented sensor mounting, and a consistent operating state.
Start with the mechanical arrangement:
- Motor drive-end and non-drive-end bearing locations.
- Pump bearing housings, where accessible.
- Coupling area and shaft line.
- Baseplate, frame, and nearby structural points when looseness or resonance is suspected.
- Suction and discharge piping supports if pipe strain or hydraulic excitation may be contributing to the problem.
At each relevant bearing location, collect horizontal, vertical, and axial measurements where access allows. These directions are not decorative. They reveal different mechanical behavior. Radial readings can expose imbalance, looseness, structural response, and some bearing problems. Axial vibration often deserves more attention around couplings, thrust bearings, and alignment faults.
A route sheet should identify the exact point rather than saying “pump bearing.” That description is operationally useless. Specify the bearing, side, direction, and mounting surface. “P-204 pump, drive-end bearing housing, horizontal, magnetic mount” can be repeated. “Pump vibration” cannot.
Use a mounting method that survives comparison
The sensor should sit on solid metal at or near the bearing housing, as close to the bearing as practical. A measurement taken across a thin cover, guard, or flexible panel may describe the panel more enthusiastically than the bearing.
For routine trending, screwed or stud-mounted sensors generally provide stronger repeatability than a handheld probe. Magnetic mounting can work well when the surface is suitable and the route requires speed, but the method must remain consistent. A handheld probe introduces another variable: pressure, angle, contact point, and operator technique. That does not make it worthless. It makes it dangerous to pretend that all readings are interchangeable.
Record the mounting method with the measurement. If one month’s data came from a stud-mounted sensor and the next month’s from a handheld probe, the trend needs an annotation before anyone calls it deterioration.
A vibration trend without a controlled measurement method is not a trend. It is a sequence of opinions with decimal places.
The collection record should include at least:
- Asset tag, pump type, motor rating, speed, and bearing arrangement.
- Measurement location and direction.
- Sensor type, mounting method, and instrument identification.
- Date and time.
- Overall vibration value and unit.
- Measurement bandwidth or selected analysis range.
- Speed, load, flow, suction pressure, and discharge pressure.
- Bearing temperature and motor temperature where available.
- Fluid temperature and lubrication condition.
- Recent maintenance, alignment work, bearing replacement, seal work, or process changes.
This is the foundation of pump diagnostic data collection. Without it, the later analysis inherits the same bloat that caused the bad record in the first place.
Correlate vibration with operating conditions
A pump does not vibrate in a vacuum, despite the way many maintenance forms are designed.
Speed and load can change vibration amplitude. So can flow, suction pressure, discharge pressure, fluid temperature, valve position, fluid properties, and the pump’s distance from its intended operating point. Compare readings from different operating states and you may create a false alarm or miss a developing fault.
Record the process state at the exact time of vibration measurement. “Normal operation” is not a process state. It is a vague reassurance that belongs nowhere near a diagnostic record.
The operating point changes the diagnosis
Pump operation far from the design point can produce flow separation, hydraulic instability, noise, mechanical vibration, and cavitation. Operation near the best-efficiency point generally reduces energy and maintenance costs, but it does not turn the pump into a fault-proof machine. A pump can sit near its preferred operating region and still suffer from misalignment, looseness, a damaged bearing, poor foundation stiffness, or a failing seal.
The measurement route should therefore capture:
1. Flow rate
If flow is not measured continuously, record the best available value and its source. A valve position alone does not prove flow.
2. Suction or inlet pressure
Low inlet pressure can alter hydraulic behavior and increase the risk of cavitation. The reading needs its location and unit.
3. Discharge or outlet pressure
This helps establish the pump’s operating point and reveals changes in system resistance.
4. Fluid temperature
Temperature affects viscosity, lubrication, clearances, and the interpretation of some process symptoms.
5. Pump and motor speed
A variable-speed drive makes this non-negotiable. Two readings at different speeds are not clean trend points.
6. Electrical load
Record power, current, or another available load indicator. A vibration increase accompanied by a load change tells a different story from an increase under stable load.
7. Valve and system configuration
Note bypass operation, parallel pumps, throttled discharge, recirculation, temporary strainers, and recent process changes.
8. Cavitation indicators
Record noise, pressure fluctuation, unstable flow, and changes in vibration character. Do not diagnose cavitation from a high RMS value alone.
The comparison should follow a simple discipline: same point, same direction, same mounting method, similar speed and load, and documented process conditions. When those conditions do not match, label the reading accordingly instead of forcing it into a clean-looking trend.
Build a baseline under stable conditions
A baseline is not the lowest value someone happened to capture after commissioning. It is a reference set collected when the pump operates in a known, acceptable condition with stable speed, load, process variables, and lubrication.
For a new or recently overhauled pump, capture baseline data after the equipment reaches a representative operating state. Record enough context to reproduce the measurement. If the pump routinely runs across several operating regimes, create separate baselines rather than averaging everything into one comforting but useless number.
That gives the maintenance team a more credible comparison:
| Trend point | What it tells you | What can invalidate the comparison |
|---|---|---|
| Same pump, same speed, same load, same sensor point | Useful change over time | A change in mounting or instrument setup |
| Same pump, different speed | Possible speed-related response | Treating amplitude as directly comparable |
| Same pump, different flow or pressure | Possible hydraulic influence | Calling the result mechanical deterioration |
| Same point, different sensor direction | Directional behavior | Comparing radial and axial values as one metric |
| Same pump after alignment or bearing work | Effect of intervention | Ignoring the maintenance event in the trend |
| High vibration with stable process conditions | Stronger evidence of mechanical change | Diagnosing the root cause from RMS alone |
This is where an industrial pump maintenance audit earns its keep. It tests whether the site can reproduce its own observations. If it cannot, the report may look polished while the evidence remains weak.
Combine vibration with the rest of the pump health picture
Overall vibration amplitude has value. It also has limits that no amount of dashboard polish can remove.
A high value may indicate imbalance, misalignment, looseness, bearing degradation, hydraulic excitation, cavitation, or a structural response. A normal overall value does not prove that the pump is healthy. Early bearing damage, intermittent looseness, process instability, and narrow-band faults can hide inside an acceptable broad-band number.
That is why vibration should sit beside other condition data, not above it.
Capture these auxiliary measurements
A practical pre-diagnostic equipment inspection should include:
- Bearing temperature and its rate of change.
- Shaft-seal pressure or leakage where relevant.
- Lubricant type, level, condition, and recent replenishment.
- Motor winding temperature if available.
- Motor current or electrical power.
- Inlet and outlet pressure.
- Flow rate when the system provides it.
- Shaft speed and drive frequency for variable-speed equipment.
- Coupling guard condition and visible signs of contact.
- Foundation, baseplate, anchor bolt, and grout condition.
- Pipe supports and evidence of strain.
- Recent work orders and component replacements.
- Abnormal noise, pulsation, leakage, or odor reported by operators.
The point is not to collect every possible signal because more fields look impressive in a CMMS. The point is to collect signals that can separate competing explanations.
Suppose vibration rises while bearing temperature, motor load, and process conditions remain stable. That supports a different investigation path than a rise that appears only when flow falls sharply. Suppose axial vibration increases after coupling work while radial values remain broadly unchanged. That deserves a different response from a pump that shows broadband growth in every direction after a lubrication failure.
Root-cause analysis begins when the vibration number stops being treated as the root cause.
Read the failure categories as competing hypotheses
Do not attach a fault label because the software offered one in a dropdown. Treat each category as a hypothesis that needs supporting evidence.
Imbalance
Imbalance often produces a strong rotational component and a pronounced radial response, but the interpretation depends on speed, rotor configuration, foundation response, and measurement quality. Check for deposits, damaged impellers, coupling problems, and changes in operating conditions before recommending rotor correction.
Misalignment
Misalignment can appear through axial vibration, coupling-related spectral behavior, phase relationships, and elevated bearing response. It may also coexist with soft foot, pipe strain, or a distorted base. Replacing the coupling without checking the shaft train is the industrial equivalent of repainting a warning light.
Mechanical looseness
Looseness can involve bearing fits, mounting bolts, baseplate connections, structural joints, or internal components. It may produce harmonics, impact-like time waveform behavior, and inconsistent readings. A loose foundation can amplify other faults and make a modest mechanical problem look catastrophic.
Bearing degradation
Bearing damage can produce characteristic high-frequency or envelope behavior before the overall value becomes dramatic. But a bearing reading may also reflect misalignment, imbalance, looseness, lubrication problems, or hydraulic forces. Do not authorize a bearing replacement solely because the overall RMS value crossed an arbitrary line.
Cavitation and hydraulic instability
Cavitation may create broadband energy, noise, unstable process behavior, and changes in pressure or flow. The investigation must include suction conditions, available net positive suction head, fluid temperature, restrictions, strainers, valve configuration, and the pump’s operating point. Vibration alone cannot distinguish every hydraulic problem.
Resonance or structural amplification
A pump may generate ordinary forcing energy that becomes a serious vibration problem because the structure responds poorly at a particular speed. Check the base, supports, pipework, and speed-dependent behavior. A stronger bearing housing is not always the answer. Sometimes the structure has simply been invited to participate in the wrong frequency range.
Use standards without turning them into decorative authority
Standards help define measurement scope and instrumentation expectations. They do not remove the need for engineering judgment.
ISO 10816-7:2009 applies to vibration evaluation of rotodynamic pumps used in industrial applications with nominal power above 1 kW. It addresses measurements on non-rotating parts and rotating shafts. The current ISO information identifies ISO/AWI 20816-7 as a standard under development intended to replace the existing edition.
ISO 20816-3:2022 covers broad-band vibration measurements on industrial machinery above 15 kW operating between 120 and 30,000 revolutions per minute. It explicitly excludes rotodynamic pumps covered by ISO 10816-7, as well as submerged motor-pumps. That exclusion matters. Applying a familiar zone chart to every pump because the chart is easy to find is not a standards-based method. It is taxonomy failure wearing a hard hat.
For monitoring under ISO 20816-3 guidance, the measuring equipment should provide a flat broad-band RMS response from at least 10 Hz to 1,000 Hz. For machines operating at or below approximately 600 revolutions per minute, the lower flat-response limit should not exceed 2 Hz. These are measurement-system considerations, not universal permission to assign one alarm value to every pump in the plant.
Define alarms around the equipment, not around a template
No single vibration alarm or shutdown limit applies to every industrial pump. Limits depend on pump type, power, speed, bearing arrangement, foundation, measurement location, manufacturer guidance, standard applicability, equipment criticality, and historical behavior.
A workable alarm structure usually combines:
- Manufacturer limits where available.
- Applicable standard and measurement location.
- Baseline value and normal variation.
- Rate of change over time.
- Process operating state.
- Consequence of failure.
- Corroborating temperature, pressure, electrical, and inspection data.
- The reliability of the measurement method.
A critical pump with no standby capacity may require a different escalation path from a small auxiliary pump with a short replacement window. That does not mean one can ignore standards. It means the standard cannot make the decision alone.
If a report states only “vibration is above limit,” ask three questions:
1. Which limit?
2. At which measurement point and operating condition?
3. What independent evidence supports the diagnosis?
If the answer collapses into “the software flagged it,” the investigation has not started.
Avoid the data-collection traps that corrupt diagnosis
Most failed pump investigations repeat the same errors. They are not exotic analytical failures. They are basic design failures in the inspection process.
1. Taking one overall value and stopping
A single overall RMS value can identify change, but it rarely identifies cause. Collect directional readings and, where the fault hypothesis requires it, spectral, phase, and time waveform data. Use the overall value as an entry point, not a verdict.
2. Comparing incompatible operating states
Do not compare a reading at full flow with one taken during throttled operation and call the difference deterioration. Log speed, load, flow, pressures, and temperature. If the state changed, explain the change.
3. Moving the sensor point
A reading from the bearing housing is not automatically comparable with one from a nearby cover. Mark the point physically or document it precisely. Small route changes create large interpretive problems when the machine has multiple structural paths.
4. Treating mounting methods as equivalent
Handheld, magnetic, and stud-mounted measurements do not produce identical repeatability. Keep the method consistent or record the change and qualify the trend.
5. Calling every high reading a bearing fault
Bearings often receive blame because they are replaceable and the software can name them. That does not make them guilty. Check alignment, balance, looseness, lubrication, foundation, process conditions, and hydraulic behavior.
6. Ignoring recent maintenance
A new bearing, coupling, seal, impeller, baseplate repair, or alignment job changes the diagnostic context. Capture the work order, parts used, clearances, alignment method, and post-maintenance baseline. “Recently serviced” is not enough.
7. Hiding uncertainty behind alarm colors
Green, amber, and red simplify communication. They do not simplify physics. A red value with poor mounting and unstable process conditions may deserve a measurement repeat before a shutdown decision. A green overall value with a developing spectral fault may deserve closer analysis.
8. Treating the checklist as a safety procedure
Condition monitoring does not replace lockout/tagout, hazardous-area controls, guarding requirements, or competent maintenance practice. Collecting vibration data near rotating equipment remains a controlled activity. The instrument does not make the machine safe.
Turn the checklist into a repeatable service route
A checklist works when it changes technician behavior, not when it adds another form to the maintenance system.
Before the route, confirm the asset identity, criticality, safe access, operating regime, instrument status, and measurement points. During the route, record the values and context together. After the route, compare against the correct baseline and escalate only when the evidence supports escalation.
A clean route sequence looks like this:
1. Confirm the asset and duty
Verify the pump tag, service, rated speed, motor power, operating mode, and whether parallel or standby equipment changes the process state.
2. Inspect before measuring
Look for leakage, loose hardware, damaged guards, pipe strain, poor supports, unusual noise, coupling condition, lubrication issues, and visible foundation problems.
3. Record the operating state
Capture speed, flow, suction pressure, discharge pressure, fluid temperature, electrical load, and valve or bypass configuration.
4. Measure the defined points
Use the prescribed sensor and mounting method at the motor and pump bearing locations. Collect horizontal, vertical, and axial readings where practical.
5. Capture supporting health data
Add bearing temperature, seal condition, lubrication details, motor temperature, current, and any available process-monitoring values.
6. Investigate deviations
If the reading differs from baseline, repeat the measurement and confirm the operating state before interpreting the change.
7. Select the next diagnostic layer
Use spectrum, phase, waveform, thermography, alignment verification, balancing inspection, hydraulic review, or physical inspection according to the competing fault hypotheses.
8. Document the conclusion and its confidence
Separate observed facts from interpretation. State what the data supports, what it does not prove, and what evidence the next action requires.
That last step prevents a common failure in industrial service: turning a preliminary indication into a confident repair order. A good report can say, “The pattern is consistent with misalignment; verify coupling alignment and soft foot under controlled conditions.” A bad report says, “Replace bearings,” because the overall number looked unpleasant.
The blunt verdict
Do not build your pump vibration program around a number. Build it around repeatability.
Use fixed bearing locations. Use consistent mounting. Record the pump’s speed, load, flow, pressure, temperature, lubrication, and maintenance history. Combine vibration with electrical, thermal, hydraulic, and visual evidence. Use ISO documents to define the measurement framework, not to outsource judgment. Treat imbalance, misalignment, looseness, bearing damage, cavitation, and resonance as hypotheses until the evidence separates them.
The right approach is simple, but not simplistic: document the machine state, measure the same way every time, correlate the signals, then choose the repair. Do this—not a dashboard full of noise and a single alarm color.